6 min to read
Statistics - Descriptive Statistics - Summarizing data
This article is a part of the Statistics - 101 series, you can access the full version of the series here:
-
Foundation
-
Descriptive Statistics
- Summarizing data (you are here!)
- Visualization
-
Inferential Statistics
-
- Probability and distribution
- Hypothesis testing
- Estimation
- Regression
Welcome to the second article of the Statistics 101 series. In the last article, we have gone through some basic terminology in Statistics. Recall that in Statistics, there are descriptive and inferential stats. In this article, we will discuss how to describe the data at hand using descriptive statistics. After reading this article, you will learn:
1. Describing data with averages
Averages consist of numbers (or words) about which the data are, in some sense, centered. They are often referred to as measures of central tendency, the several types of average yield numbers or words that attempt to describe, most generally, the middle or typical value for a distribution.
There are three measures that reflect such information about the data. They are mean, mode and median
1.1. Mean
Definition
The mean is found by adding all scores and then dividing by the number of scores. This formula holds for both population mean and sample mean.
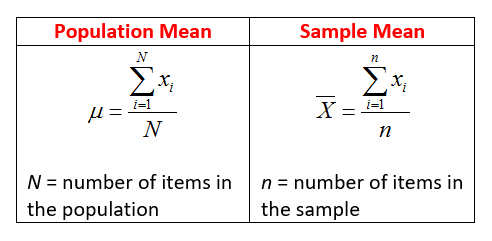
If you are confused between sample and population, refer to the last article.
Advantage and disadvantage
- Advantage: The mean reflects the values of all scores
- Disadvantage: The mean is sensitive to outlier
1.2. Mode
Definition
The mode reflects the value of the most frequently occurring score. To compute the mode of the data, count the frequency of every unique value in the data and there you go!
Advantage and disadvantage
- Advantage: Easy to compute without any formula
- Disadvantage: Data can have more than one mode, or none at all
1.3. Median
Definition
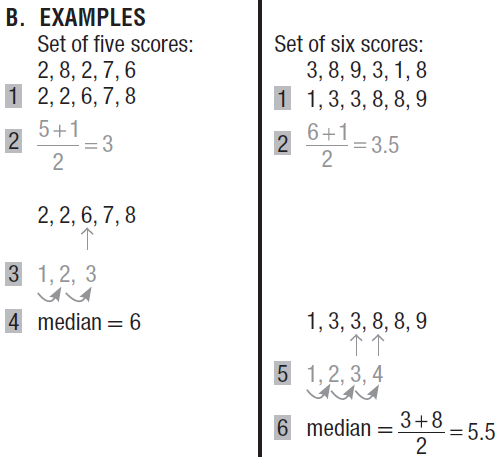
The median reflects the middle value when observations are ordered from leastto most. The steps to calculate the median of the data can be summarized here:
- Order scores from least to most.
- Find the middle position by adding one to the total number of scores and dividing by 2.
- If the middle position is a whole number, as in the left-hand panel below, use this number to count into the set of ordered scores.
- The value of the median equals the value of the score located at the middle position.
- If the middle position is not a whole number, as in the right-hand panel below, use the two nearest whole numbers to count into the set of ordered scores.
- The value of the median equals the value midway between those of the two middlemost scores; to find the midway value, add the two given values and divide by 2.
Advantage and disadvantage
- Advantage: Not sensitive to outlier, since it only reflects the value in the middle
- Disadvantage: Only reflects the value in the middle, thus, not takes into account all the data
2. Describing variability
Averages are important, but they tell only part of the story. When summarizing a set of data, we specify not only measures of central tendency, such as the mean, but also measures of variability, that is, measures of the amount by which scores are dispersed or scattered in a distribution. Such variability can be explained using range, variance & standard variation and interquartile range
2.1. Range
Definition
The range is the difference between the largest and smallest scores.
Advantage and disadvantage
- Advantage: Easy to understand, easy to be calculated
- Disadvantage: Value depends on only 2 scores. Range is also not a stable measure, since it tends to increase as the amount of data increases.
2.2. Variance & standard deviation
Variance and standard deviation is the most preferred measure of variability among the 3 discussed.
2.2.1. Variance
Definition
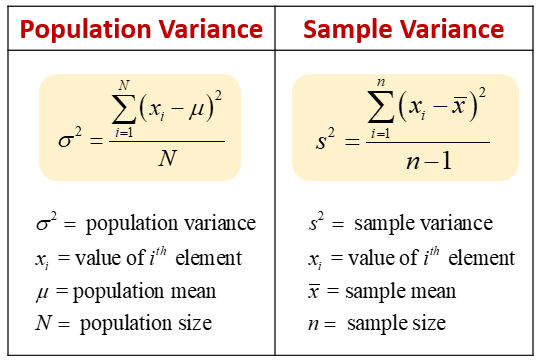
Variance is computed by first adding up all the squared deviation between the actual value and the mean. Why squared deviation, you may ask. We do not use deviation here since it would not yield much information.
Let’s take this sequence: 1,3,5,7,9. We can easily compute the sample mean of that sequence to be equal to 5, and the sum of the deviation would be 0! Well 0 variability is not appropriate right! As a result, we use the squared deviation to avoid the situation of deviations cancelling out each other.
After retrieving the sum of squared deviation, the formula of variance for population and sample varies, as shown in the formula below.
Why are there 2 formula for population and sample variance? This will be further discussed in later post.
Advantage and disadvantage
- Advantage: Use all the data supplied. Used as the basis for standard deviation, another meaningful measure.
- Disadvantage: Not really a meaningful measure itself, since the unit of the data is squared. For example, pounds would make sense, but not squared pounds
2.2.2. Standard deviation
Definition
You might find it helpful to think of the standard deviation as a rough measure of the average (or standard) amount by which scores deviate on either side of their mean. Standard deviation is calculated by taking square root of variance.
Advantage and disadvantage
- Advantage: SD is a very meaningful measure: Majority of scores within one standard deviation on either side of the mean. A small minority of scores deviate more than two standard deviations. This is true regardless of the true distribution of the data.
- Disadvantage: Must calculate variance first
2.3. Interquartile range
Definition
The most important spinoff of the range, the interquartile range (IQR), is simply the range for the middle 50 percent of the scores.
More specifically, the IQR equals the distance between the third quartile (or 75th percentile) and the first quartile (or 25th percentile), that is, after the highest quarter (or top 25 percent) and the lowest quarter (or bottom 25 percent) have been trimmed from the original set of scores. Since most distributions are spread more widely in their extremities than their middle, the IQR tends to be less than half the size of the range.
Advantage and disadvantage
- Advantage: Not sensitive to extreme scores
- Disadvantage: Computationally heavier than other measure.

Comments